Select date

The easiest way to show the COVID vaccines are a disaster and that the medical community is looking the other way


by Steve Kirsch, Steve Kirsch’s newsletter:
 If you look at the VAERS data by vaccine type, and look at the time of onset of symptoms, you gain insights into the vaccines that nobody else pays attention to. Why are doctors ignoring this data?
My favorite VAERS query tool is medalerts.org. Without a lot of effort, you can do some amazing analyses that prove to anyone who still has critical thinking skills that the COVID vaccines are CAUSING serious side effects.
TRUTH LIVES on at https://sgtreport.tv/
If a vaccine isn’t causing a side effect, the reporting rate in VAERS will be determined by the public’s propensity to report (which drops over the time from the shot). This is the “background” reporting rate.
But if you are looking at the COVID vaccines, which are claimed to be super safe, the plot of the onset time (time between shot and symptom) over time since the shot have to track each others shape within the statistical margin of error since they are both simply reporting the background uncorrelated event.
Guess what? They don’t track.
They depend on the vaccine type given. Whoops!
That’s a sure sign of harm. No doubt about it.
But the medical community is completely oblivious to any of this.
I’ll provide one example. You can repeat this process for all 770 other side effects that triggered the CDC’s safety signals.
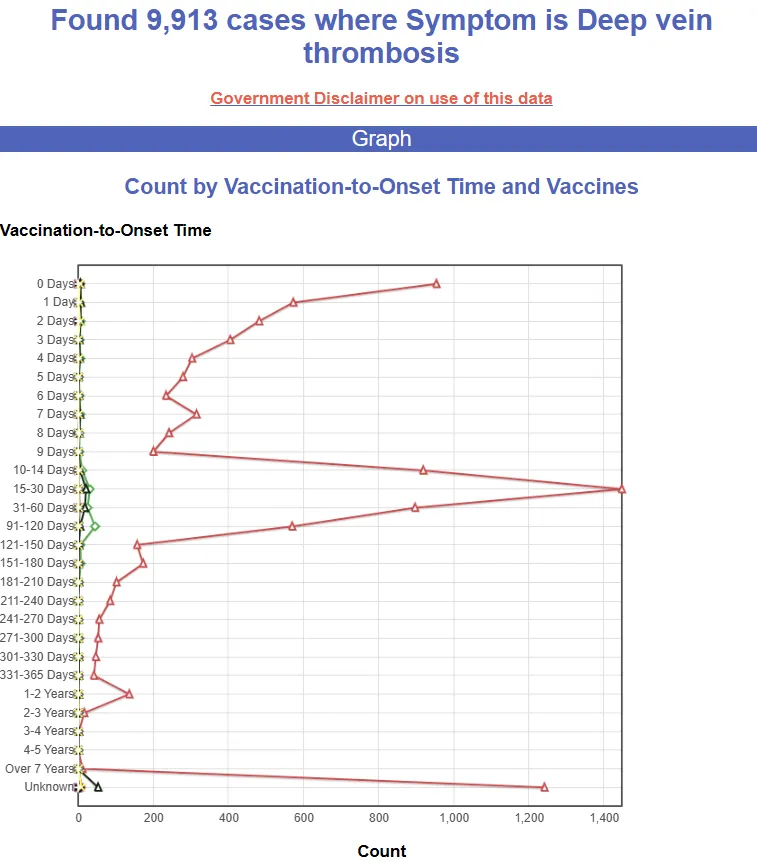
DVTs, a life threatening condition, are not a side effect of the COVID vaccines according to every mainstream health authority in the world. Nobody ever talks about them.
Are they safe? Hell no.
Check this out:

That’s the Pfizer vax with the greatest counts, but the Moderna curve looks different in shape. That means the curves are not reporting background events.
There is no possible explanation for this other than the vaccines have different safety profiles.
To prove to yourself this isn’t just “background” reporting, you run all vaccine types in your query and not just the different COVID manufacturers.
Here’s the plot for all vaccine types in the entire 30+ year history of VAERS:
As you can see, the COVID vaccine type has a vastly different temporal response curve than the other vaccine types, despite the fact that, for example, the flu shot is given to 6 times more people (over 30+ years) than the COVID shot has been delivered. There’s just no doubt about it.
Nobody can explain these two graphs above with a straight fact.
This is why nobody wants to debate me.
Read More @ kirschsubstack.com

